National Indicators
Israel National Indicators (2016)
Exports as a % of GDP: 29.9%
(“Country statistical profile: Israel 2019/2.”)
General government spending as a % of GDP: 38.6%
(“Country statistical profile: Israel 2019/2.”)
Net investment in non financial assets as a % of GDP: 0.5%
(“Databank.”)
Tax revenue as a % of GDP: 31.3%
(“Country statistical profile: Israel 2019/2.”)
Imports as a % of GDP: 28.1%
(“Country statistical profile: Israel 2019/2.”)
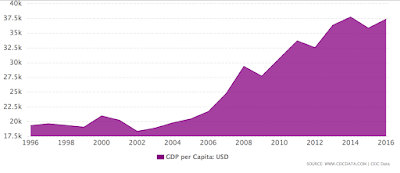
GDP over the last 20 years:

Israel appears to be in economic recovery. Image at www.ceicdata.com/datapage/charts/ipc_israel_gdp-per-capita?type=area&from=1996-12-01&to=2016-12-01&lang=en
(“Country statistical profile: Israel 2019/2.”)
GDP over the last 20 years:

Israel appears to be in economic recovery. Image at www.ceicdata.com/datapage/charts/ipc_israel_gdp-per-capita?type=area&from=1996-12-01&to=2016-12-01&lang=en
Works Cited
“Country statistical profile: Israel 2019/2.” OECD iLibrary, OECD. www.oecd-ilibrary.org/economics/country-statistical-profile-israel-2019-2_g2g9e702-en
“Databank.” The World Bank, The World Bank. databank.worldbank.org/data/source/world-development-indicators
“Databank.” The World Bank, The World Bank. databank.worldbank.org/data/source/world-development-indicators

Comments
Post a Comment